How India Compares to the World on Learning Outcomes
Researchers at the World Bank recently released an excellent new dataset on learning outcomes by country.The dataset is here and a journal article describing the dataset is here. This is the first dataset on learning outcomes (rather than educational attainment) which includes most low income countries. (Hanushek and Woesmann created a cross country dataset on learning outcomes some time back but it only included 77 countries.)
How well does India do according to the HLO dataset?
I was curious to see how India does compared to other countries in the HLO dataset. The HLO dataset reports HLOs by subject and year so I first calculated the mean HLO for the most recent year data was available for each country and merged in data on GDP per capita from the World Bank. The figure below plots mean HLO for the most recent year available versus log GDP per capita for each country in the dataset.(I also label several other countries for reasons that will become clear in the next section.) According to the HLO dataset, India does about as well as would be expected given its level of income.
library(tidyverse); library(readxl); library(ggrepel)
hlo <- read_excel("C:/Users/dougj/Documents/Data/Education/HLO/hlo_database.xlsx", sheet = "HLO Database")

# Take the mean by year, get the latest year
hlo_latest <- hlo %>% group_by(code, year) %>%
  summarise(hlo = mean(hlo)) %>%
  ungroup() %>% group_by(code) %>%
  slice_max(order_by = year)

# Merge with GDP per capita. I grabbed this dataset from Our World in Data but the source is the World Bank. Link here https://ourworldindata.org/grapher/gdp-per-capita-worldbank
gdp <- read_csv("C:/Users/dougj/Documents/Data/gdp-per-capita-worldbank.csv") %>% rename(gdp = `GDP per capita, PPP (constant 2011 international $)`, code = Code, year = Year)

# generate list of countries for which we have PAL data
pal_countries <- c("IND", "PAK", "KEN", "UGA", "TZA", "MLI", "SEN", "MEX", "NGA")

# Data for 7 countries doesn't merge. I just drop these
unmerged <- hlo_latest %>% anti_join(gdp, by = c("code", "year"))
hlo_latest <- hlo_latest %>% left_join(gdp, by = c("code", "year")) %>%
  mutate(sample = if_else(code %in% pal_countries, "PAL country", "Others")) %>%
  mutate(log_gdp = log(gdp), code = if_else(code %in% pal_countries, code, ""))


# Graph HLO versus GDP
p <- ggplot(hlo_latest, aes(log_gdp, hlo, label = code)) +
  geom_point(aes(colour = sample)) + geom_smooth(method = "lm") +
  geom_text_repel() +
  labs(title = "Most recent average HLO versus GDP per capita (PPP)")
print(p)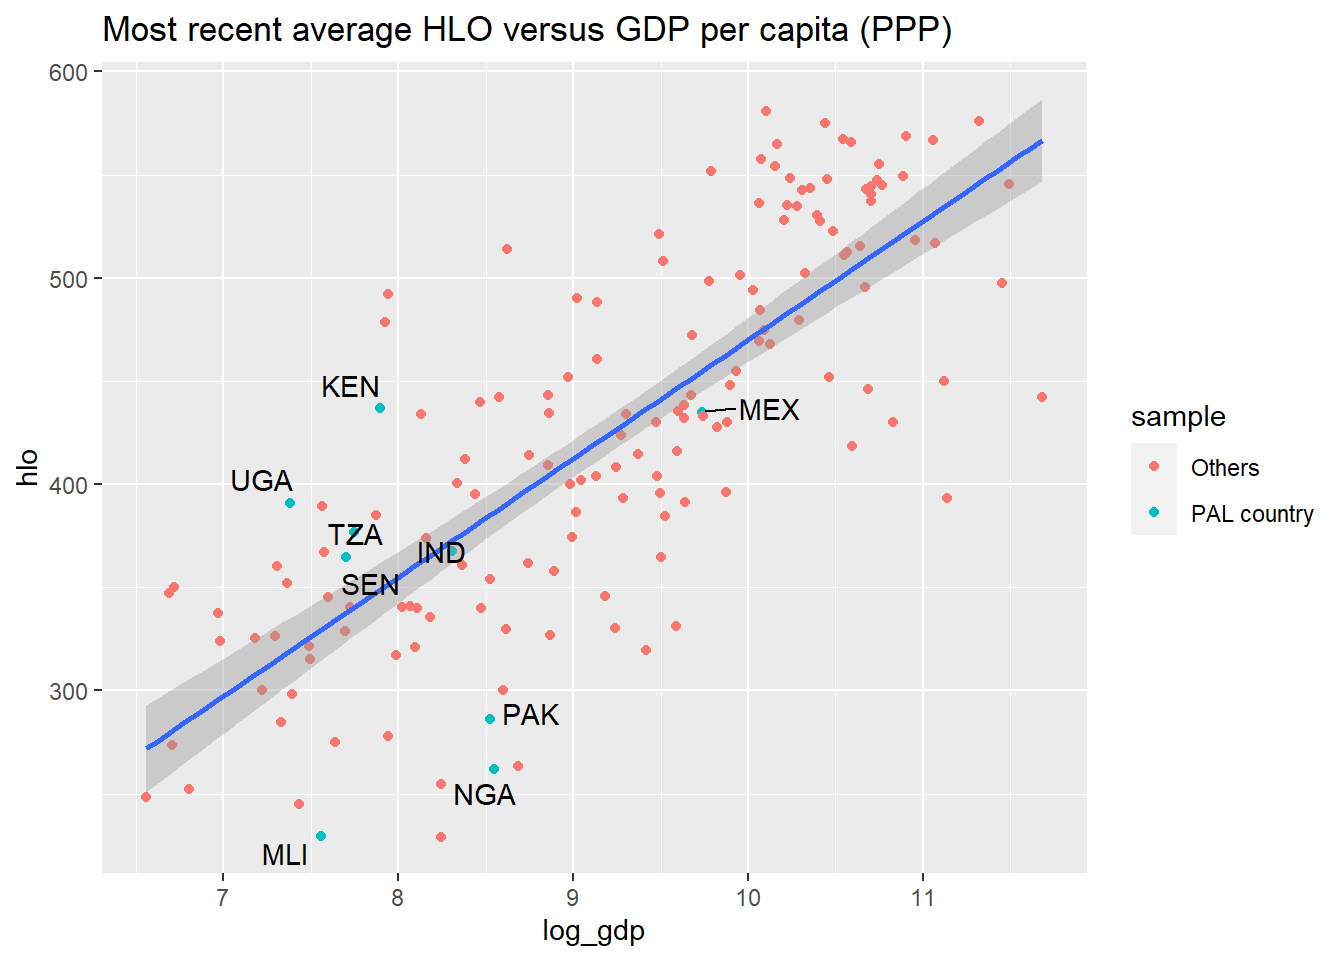
Comparing India to other countries based on ASER
The HLO dataset is fantastic but to generate comparable data for so many countries the creators of the dataset had to make some heroic assumptions. The HLO value for India relies entirely on one assessment: the 2009 PISA conducted in Tamil Nadu and HP. My first thought upon realizing this the 2009 PISA likely substantially over-estimates learning outcomes in India since Tamil Nadu is a relatively wealthy state and HP has a reputation for having a good education system. (HP was cited as an example of a high-performing state in the PROBE report.) Surprisingly, according to the IHDS 2012 survey, students in HP and Tamil Nadu are fairly representative of Indian students overall. The code below shows that the population weighted average of the two states is right around the average for the entire country. (HP does really well but Tamil Nadu does surprisingly poorly. I am using IHDS here rather than ASER because ASER excluded rural areas and a very large share of Tamilians live in cities. Also, I am averaging ASER scores for all children 8-11 in the sample which is not a great idea but should at least give a rough sense of HP and TN’s relative performance.)
library(haven); library(gt)
ihds_ind_dir <- "C:/Users/dougj/Documents/Data/IHDS/IHDS 2012/DS0001"
ind_file <- file.path(ihds_ind_dir, "36151-0001-Data.dta")

# read in just those variables that i need
ihds <- read_dta(ind_file, col_select = c(STATEID, HHID, HHSPLITID, PERSONID, WT, RO3, RO7, RO5, URBAN2011, starts_with("CS"), starts_with("TA"), starts_with("ED")))

# drop the one row with missing values for weights and convert STATEID to factor
ihds <- ihds %>% filter(!is.na(WT)) %>% mutate(State = as_factor(STATEID))

# Look at the average of all students in TN and HP versus the rest of the country
tn_hp <- ihds %>%
  mutate(Area = (State == "Tamil Nadu 33" | State == "Himachal Pradesh 02")) %>%
  mutate(Area = if_else(Area, "HP and TN", "All other states")) %>%
  group_by(Area) %>%
  summarize(reading = weighted.mean(TA8B, WT, na.rm = TRUE),
            math = weighted.mean(TA9B, WT, na.rm = TRUE))


gt(tn_hp) %>%
  fmt_number(
    columns = c("reading", "math"),
    decimals = 2
)| Area | reading | math |
|---|---|---|
| All other states | 2.45 | 1.44 |
| HP and TN | 2.45 | 1.59 |
While Tamil Nadu and HP, taken together, are not obvious outliers when it comes to education generating a data point for the country as a whole from a single survey conducted more than a decade ago in only two states is still not ideal.
Another, in my opinion better, approach to comparing India to other countries on learning outcomes is to use data from ASER and other assessments inspired by ASER. Several countries around the world have completed assessments very similar to ASER. This webpage contains stats from ASER and other ASER-like assessments conducted in Pakistan, Kenya, Uganda, Tanzania, Mali, Senegal, Mexico, and Nigeria in 2015 or 2016 on the share of 5th grade children who can read a grade 2 text. (It also has figures for numeracy, but they aren’t really comparable across countries. For more on this very cool effort, check out the People’s Action for Learning Network). The advantages of using ASER-like assessments to compare countries are that:
In contrast to PISA and most other learning outcomes assessments, ASER-like assessments use household sampling to select children. For countries like India with high drop-out, low attendance, and incomplete lists of private schools, children selected using household sampling are likely more representative of the total population.
ASER measures foundational literacy and numeracy which is arguably more important than the higher-order skills measured by assessments like PISA.
Because it is so simple, ASER scores are pretty easy to compare across languages and contexts without the use of any opaque statistics. (Tests like PISA vary slightly from country to country so sophisticated IRT methods are required to ensure that scores are comparable. And because countries don’t all participate in one single assessment, the maintainers of the HLO dataset have to use “linking” methods to generate comparable scores from different assessments.)
ASER scores, where available, are more recent.
The downside of using these assessments is that we only have data for a few countries and, in India and Pakistan, ASER was only conducted in rural areas. To correct for the fact that the ASER was only conducted in rural areas in India and Pakistan, I add the difference between the share of rural and urban children who could read a class 2 text from the IHDS survey (which is about 10 ppt) to both the India and Pakistan ASER scores. (This is a strong assumption but in order to compare scores across countries some strong assumptions are required.)
Results from comparison of ASER scores
The first scatterplot below compares ASER scores with HLO scores on reading. For countries with multiple HLO scores, I used the score which was nearest in time to 2015-16 since that is when the ASER scores are from. The second scatterplot plots ASER scores versus log GDP per capita.
When we use ASER scores, India does considerably less well when compared to other countries. Pakistan, Kenya, Tanzania, and Uganda all have lower GDP per capita but similar or higher ASER scores. Senegal and Mali do worse on ASER but also have much lower income, Mexico does much better but is also much richer, and Nigeria does a little worse than India.
If we compare the figures below with the first figure above (the one with all the HLO scores) we see that the reason for India’s comparatively lower performance is that Nigeria and Pakistan do much better, relatively, on ASER than on the HLO measure. In both figures, Kenya, Tanzania, and Uganda do much better than India (considering their relatively low income levels) but in the first figure this is balanced out by the relatively low performance of Pakistan and Nigeria.
temp <- ihds %>%
  mutate(grade2 = as.numeric(TA8B == 4)) %>%
  group_by(URBAN2011) %>%
  summarize(reading = weighted.mean(as.numeric(grade2), WT, na.rm = TRUE))

rural_urban_diff <- temp$reading[temp$URBAN2011 == 1]- temp$reading[temp$URBAN2011 == 0]

aser <- tribble(
  ~code, ~aser_reading,
  "IND", .47+rural_urban_diff,
  "PAK", .549+rural_urban_diff,
  "KEN", .768,
  "UGA", .557,
  "TZA", .81,
  "MLI", .103,
  "SEN", .33,
  "MEX", .797,
  "NGA", .444
)

hlo_reading <- hlo %>%
  filter(subject == "reading" & code %in% pal_countries) %>%
  mutate(years_to_15_16 = abs(year - 2015.5)) %>%
  group_by(code) %>%
  slice_min(years_to_15_16, n =1, with_ties = FALSE) %>%
  left_join(aser) %>%
  left_join(filter(gdp, year == 2015), by = "code") %>% mutate(log_gdp = log(gdp))
## Joining, by = "code"ggplot(hlo_reading, aes(hlo, aser_reading, label = code, colour = sourcetest)) +
geom_point() + geom_label_repel() +
labs(title = "ASER / UWEZO vs HLO (reading)", x = "HLO reading score", y = "% 5th graders able to read class 2 text")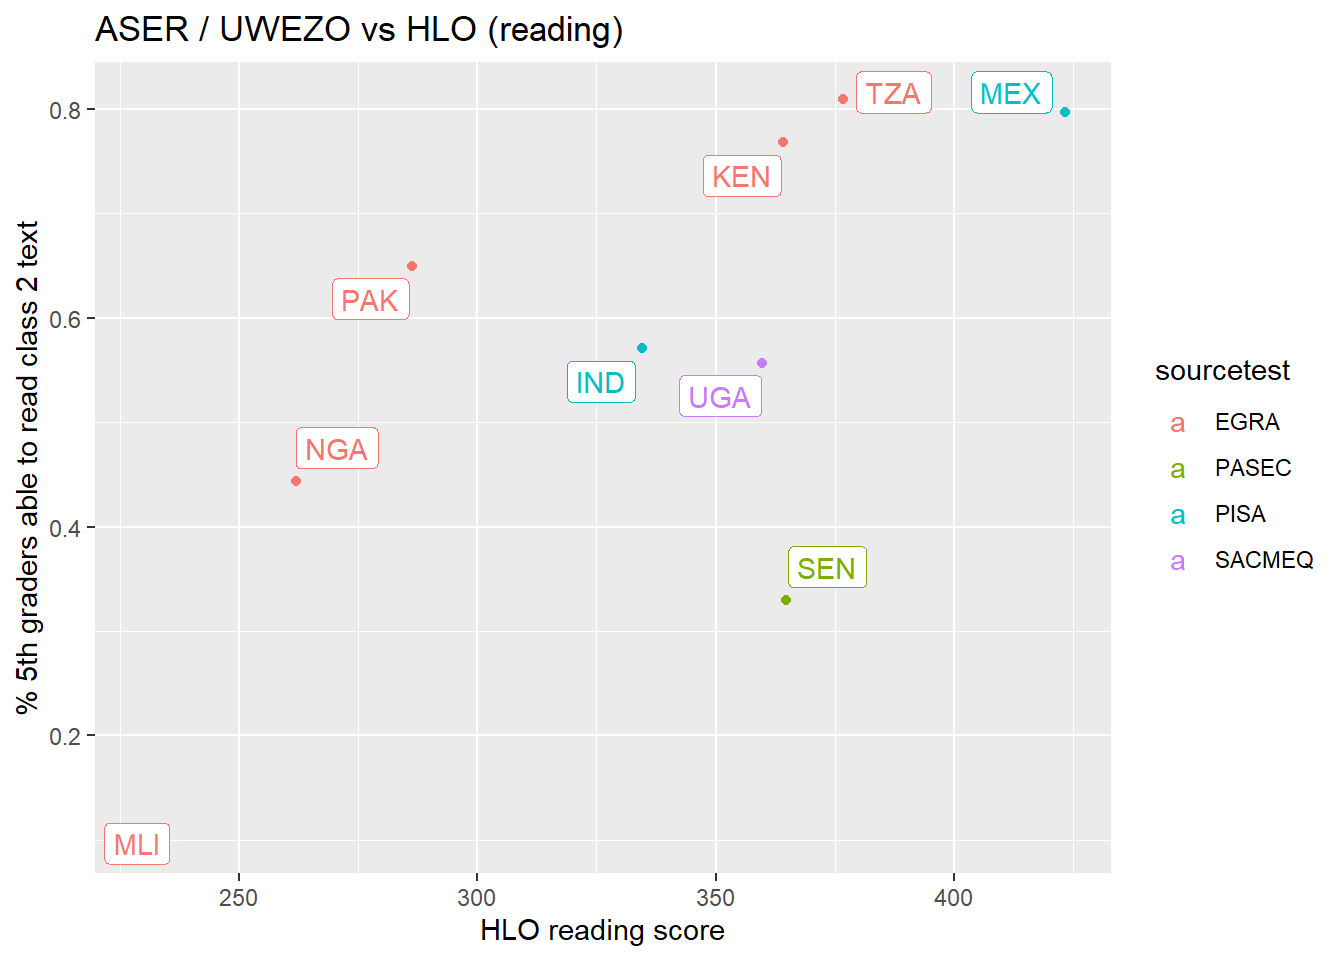
ggplot(hlo_reading, aes(log_gdp, aser_reading, label = code)) + geom_point() +
  geom_text_repel()+
  labs(title = "ASER / UWEZO vs log GDP per capita", x = "log GDP per capita", y = "% 5th graders able to read class 2 text")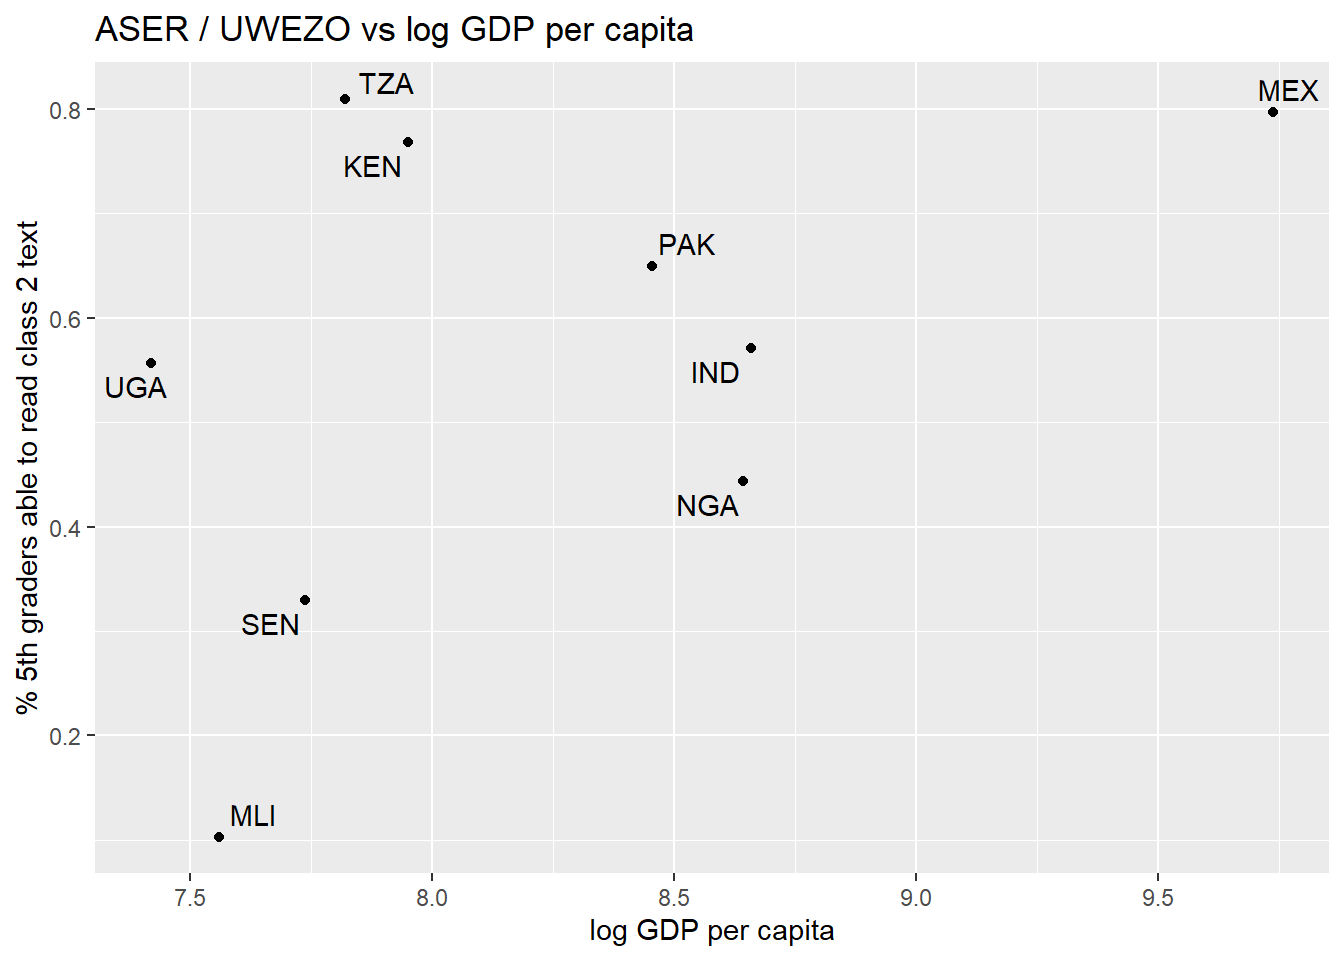
Does any of this matter?
I ran this analysis because I was curious how India’s education outcomes compared to other countries. That said, I’m not really sure it matters all that much. We know that many countries, India included, could do far better in educating their children. And, in India as in the US, country rankings (as long as they don’t involve cricket) don’t seem to generate much public interest. Better data which allows us to compare learning outcomes in India to other countries would be nice but I think that data which allows us to better track changes in learning outcomes within India is far more important. Andres and I will (hopefully) be writing more on this soon.