Estimating the Impact of State Education Policies in India Using ASER and Synthetic Controls
In a recent article Andres Parrado and I take a look at the two main sources of learning outcomes data in India – NAS and ASER – and conclude that a) NAS data is (most likely) completely unreliable and b) ASER data, while reliable, is a bit noisy.
The implications for people considering using NAS data are pretty clear – you shouldn’t. For ASER, the implications are a bit murkier. In the paper, we say that analysts should probably avoid using ASER data at the district level (which the ASER Centre already recommended) and that they should be careful about comparing year-on-year changes between states. One topic we didn’t really touch is whether ASER data can be used to evaluate the impact of state-level policies. This is a tough question to answer because it depends not just on the level of noise in the ASER data but also on the methodology used and other aspects of the data.
In this blog post, I look at whether it is possible to estimate the impact of state education policies by applying the synthetic control method (SCM) to ASER data. SCM is a popular approach to estimating aggregate policies (i.e. policies which affect an entire state or other large area) when data is only available at the aggregate level (i.e. there is no household-level data) but there is data for several time periods before the policy was implemented – exactly the situation we find ourselves with ASER data. An advantage of SCM is that it is (sometimes) pretty clear when it won’t work. As I show in the post, it is very clear that SCM, or at least all the versions of SCM that I try, won’t work with ASER data. This is not to say that there is no other method out that could use ASER data to estimate the effect of state-level policies on learning outcomes. Perhaps this method or this one, which further refine SCM, would perform better. But if a rigorous method well-suited to the data at hand doesn’t work it generally means that either you need more data or more assumptions (and thus less rigour).
As with all of my posts, this entire post was written as a reproducible R notebook. Go to the about page for more information on how to access the code.
How Not to Use ASER to Estimate the Impact of a Policy – the example of BCG in Haryana
Before diving into SCM, I first look at an example of how not to use ASER code to estimate the effect of a state-level policy. My example comes from BCG’s work with Haryana on the Quality Improvement Programme (QIP), an ambitious project to improve learning in the states’ government schools through a variety of measures including monthly student assessments, teacher training, school consolidation, and leadership training. See here for details. (I apologize for picking on BCG a bit in this post. BCG just did what we all do – paint our own efforts in the best light possible.) In two articles on their website, BCG, the strategic partner on the QIP project, claim that QIP was a “breakthrough reform” that led to “stellar gains” and that “Haryana is now the only state in India—possibly globally—to improve learning outcomes at scale so quickly.” These claims are based largely on ASER data. According to one of the articles:
“The impact of the reforms in Haryana has exceeded expectations. From 2012 through 2014, as the overhaul was being rolled out, the share of fifth graders who could do division increased 5% and the share who could read a standard second-grade text jumped 10%. That was quite a reversal: from 2010 through 2012, the share of fifth graders who could do division had fallen 26%, and the share of children who could read a standard second-grade text had dropped 17%. According to the National Achievements Survey report published in January 2016, Haryana was one of just two states in India that showed improvement in learning outcomes across all subjects, with 28 of the 30 Indian states posting declines or no change.”
The first issue with the BCG articles is that they mix data from ASER, NAS, and EI without clearly labeling the data sources. (The first article linked to above mixes data from all three sources in a single figure!) A second issue is that they compare Haryana with 5 other, seemingly arbitarily chosen states. A third more serious issue with the analysis that they claim that learning gains between 2012 and 2014 are due to QIP despite the fact that, by BCG’s own account, QIP started in 2014.
If we look at ASER data (for all students) for Haryana from 2006 to 2018, it’s easy to see why they fudged the start date a bit. If we just look at the period between 2012 and 2014, the learning gains in Haryana do indeed look impressive! (Note that these figures are for all students, not just government school students. According to ASER, 42% of rural 6-14 year olds in Haryana attended private school in 2010 and 54% attended private school in 2014. Thus, restricting attention to government school students ignores a very large segment of the student population and makes it more difficult to compare changes over time (since the students exiting government schools are likely to be different from the ones staying).)
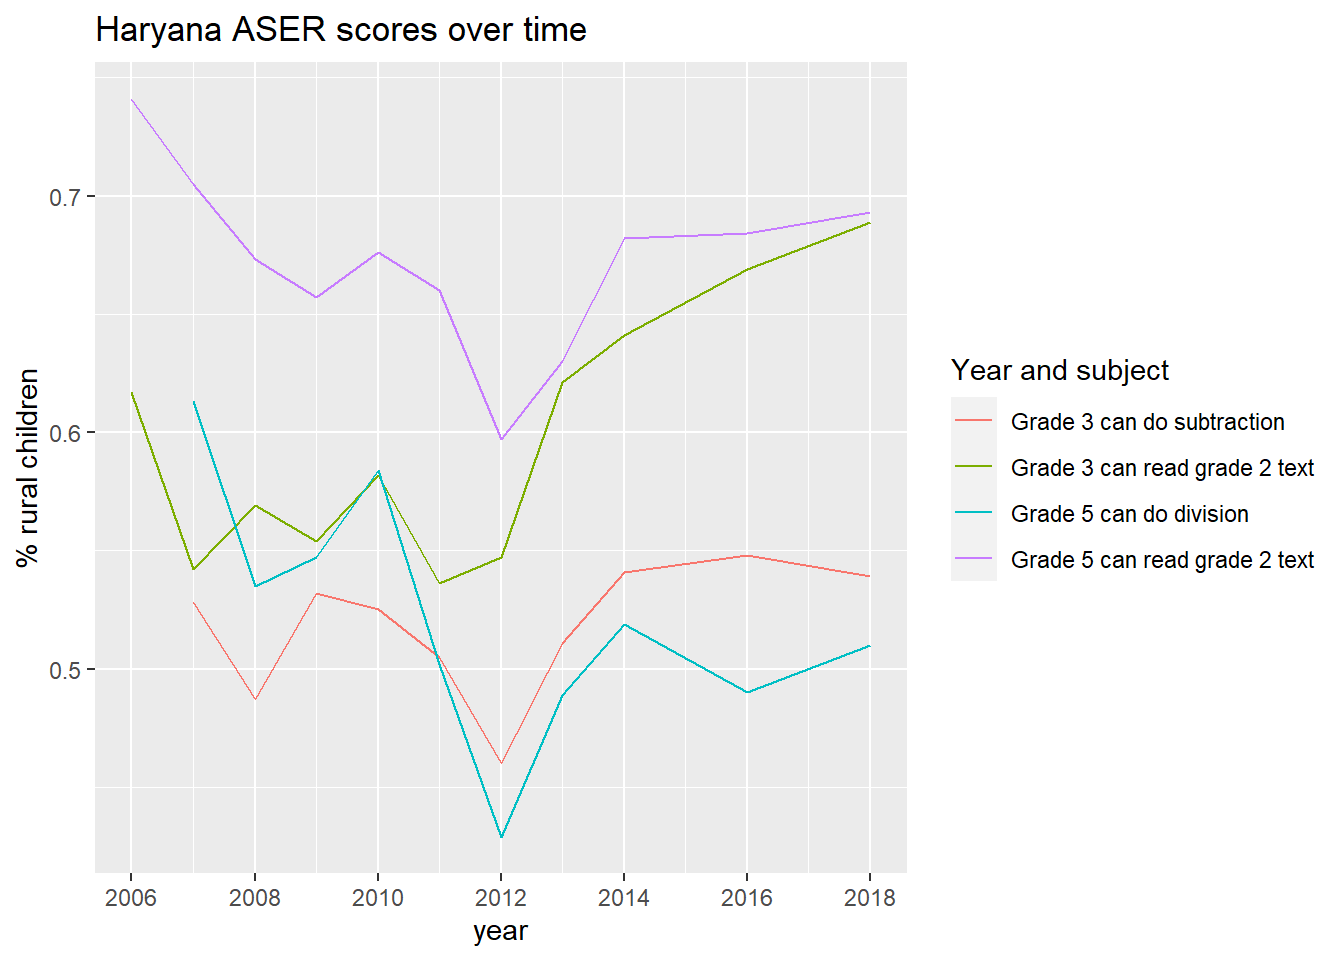
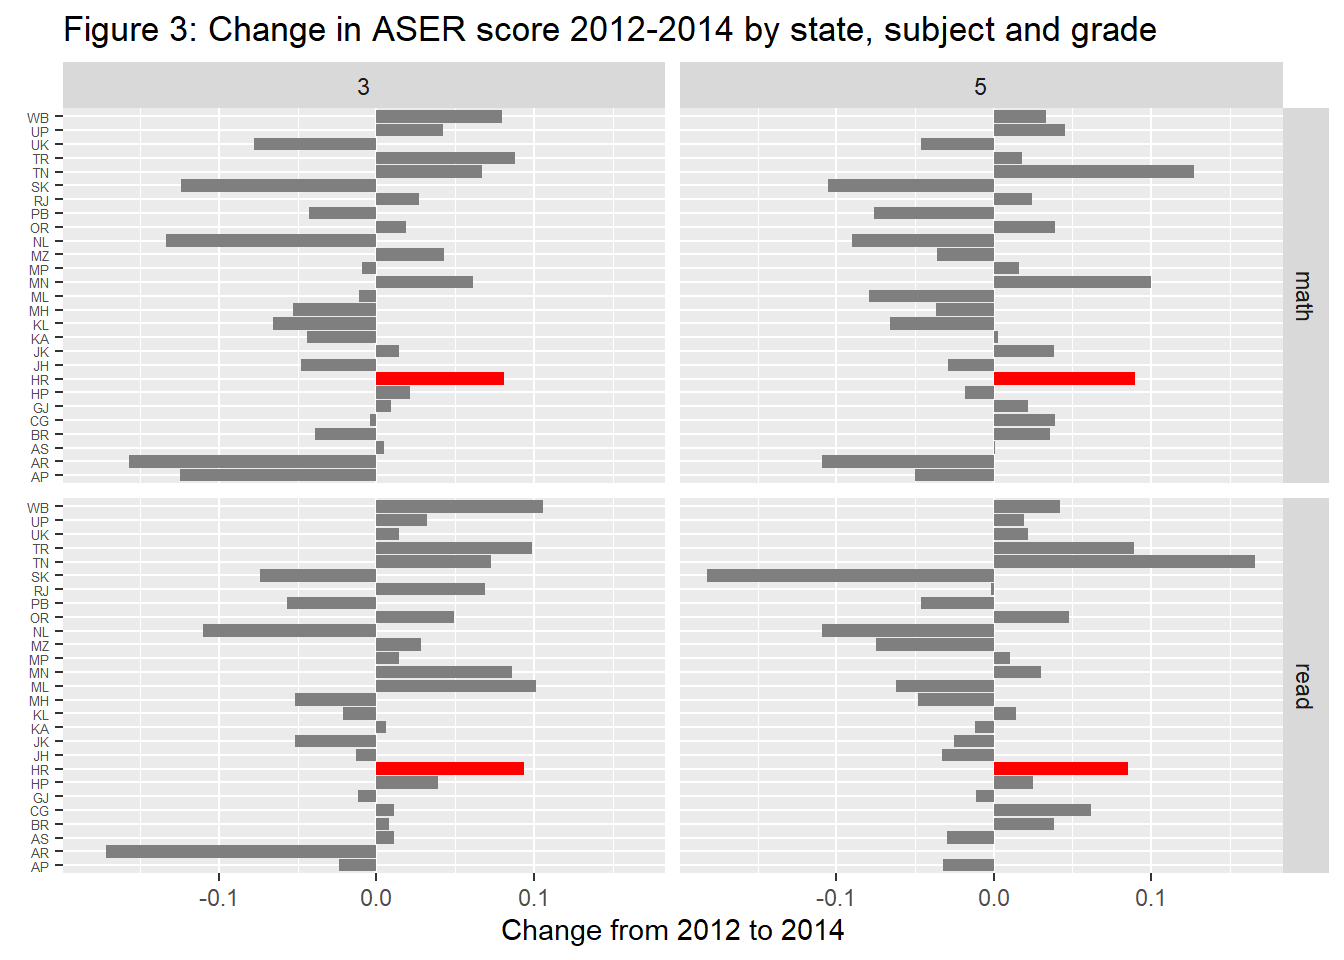
Yet, if we compare these gains with gains from other states, it’s unclear whether even with the fudged start date QIP clearly led to learning gains in Haryana. While ASER scores increased between 2012 and 2014 in Haryana, they increased just as much in other states too. Clearly, we need a more rigorous approach to estimating impact.
Using the Synthetic Control Method to Estimate the Impact of QIP
The problem with eyeballing changes in state outcomes from one period to the next (as BCG does in their articles) is that it is very difficult to say when a change is likely due to a policy rather than noise or other factors. SCM offers a more rigorous approach to estimating the impact of state-level policies. SCM creates a “synthetic control” by looking for a combination of control states that, when summed up, closely matches the outcome trajectory of the treatment state prior to the intervention. (I am skimming over a lot of details here. For example, you can specify that the synthetic control matches the treatment unit on more than just pre-treatment outcomes. See Abadie, Diamond, and Hainmuller (2011) for a complete technical description of SCM. Abadie (2019) provides an excellent overview of the method and Abadie et al (2011) provides clear guidance on how to implement SCM in R.)
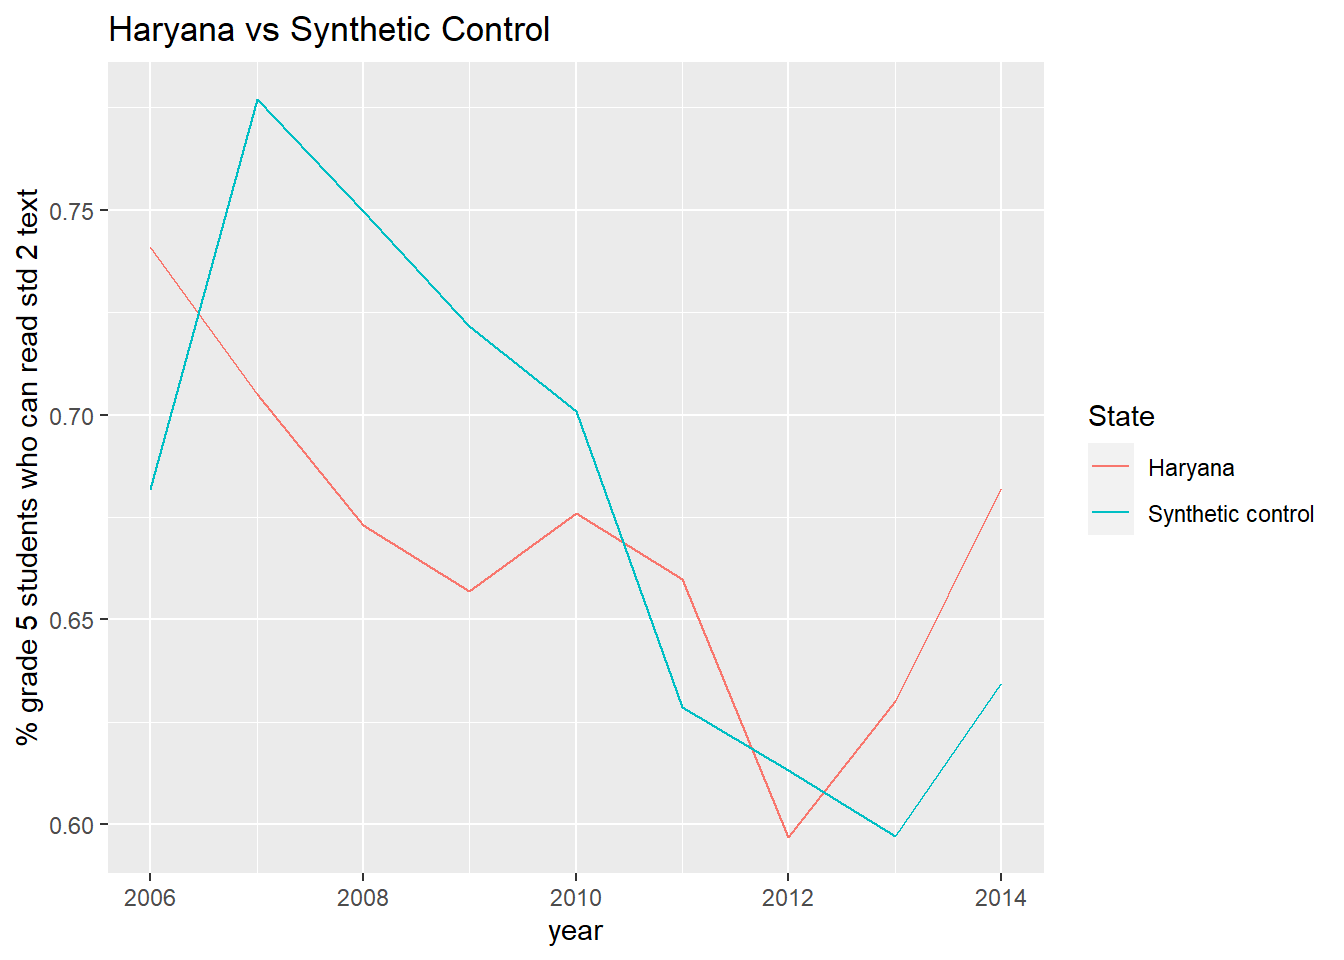
As mentioned above, an advantage of SCM is that it is often clear if it won’t work: if the synthetic control doesn’t closely match the trend of pre-treatment outcomes for the treatment unit then it clearly won’t provide a good approximation of the treatment unit post-treatment. (The converse is not necessarily true: even if the synthetic control matches the pre-intervention treatment unit trends closely it still may be a poor approximation for post-treatment outcomes.) In the code below, I attempt to estimate the effect of QIP on grade 5 reading levels using SCM, under the assumption that QIP started in 2012 and ended in 2014. (If you are viewing this from by blog, the code is hidden. See the about page for details on how to view the entire code.) The figure below shows grade 5 reading levels for the synthetic control versus Haryana for the entire time period for which we have data. (See code comments for model details such as what exact covariates I use.) Ideally, the lines for Haryana and the synthetic control should be close together until the onset of the “treatment” in 2012. Instead, we see that there are huge gaps prior to treatment – in some years, the gaps between the two lines are much large than the gap post-treatment (which is the estimated effect).
A second way to test the reliability of an SCM estimate is to calculate “placebo” effects for other states and compare the estimated effect for the treatment unit with the estimated “effect” for these other states. The figures below show the estimated “effect” for all states in 2013 and 2014. While the effect for Haryana is positive for both years the estimated effect in 2013 is smaller than the estimated placebo effect for 3 other states and smaller than the estimated placebo effect for 4 other states in 2014. (Note that this analysis assumes that there were no major education reform efforts in other states. I am not familiar with all of the reform efforts in other states, but I am not aware of any major education reform efforts in the states which have large “placebo” effects.)
## Warning: It is deprecated to specify `guide = FALSE` to remove a guide. Please
## use `guide = "none"` instead.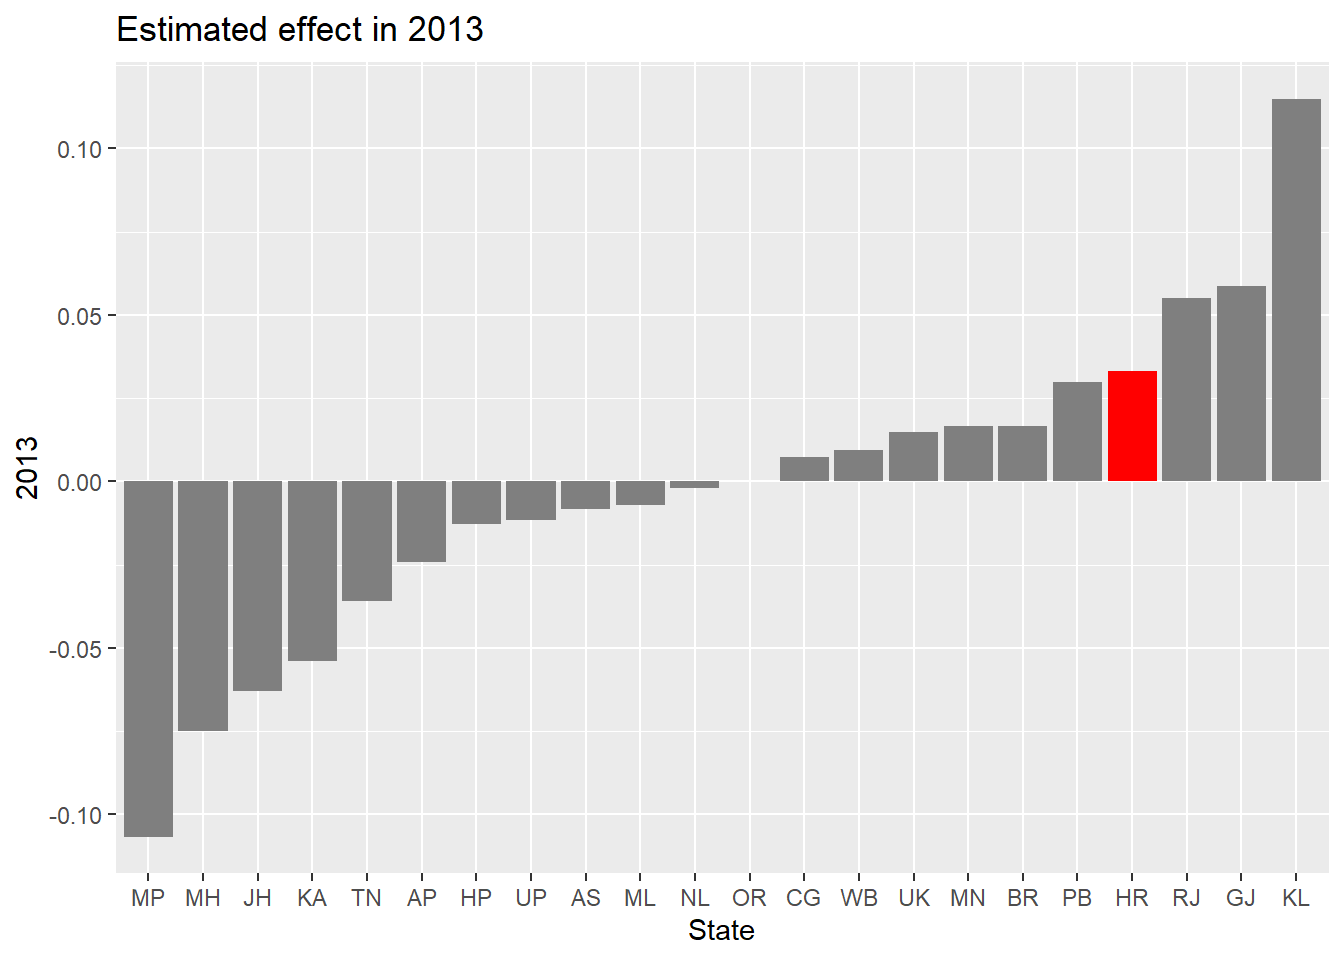
## Warning: It is deprecated to specify `guide = FALSE` to remove a guide. Please
## use `guide = "none"` instead.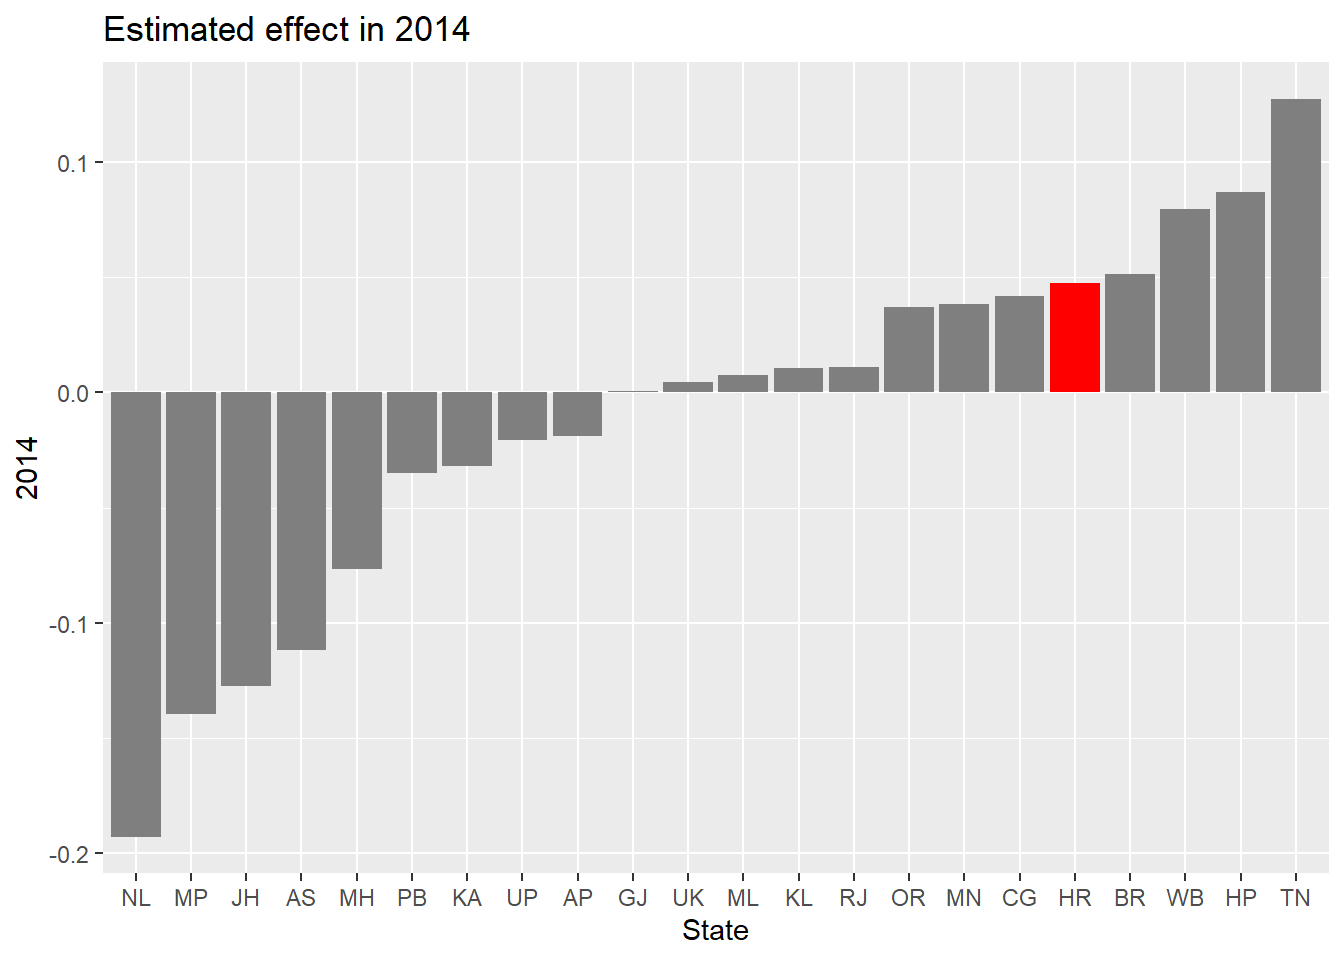
Applying SCM to Other States and Outcomes
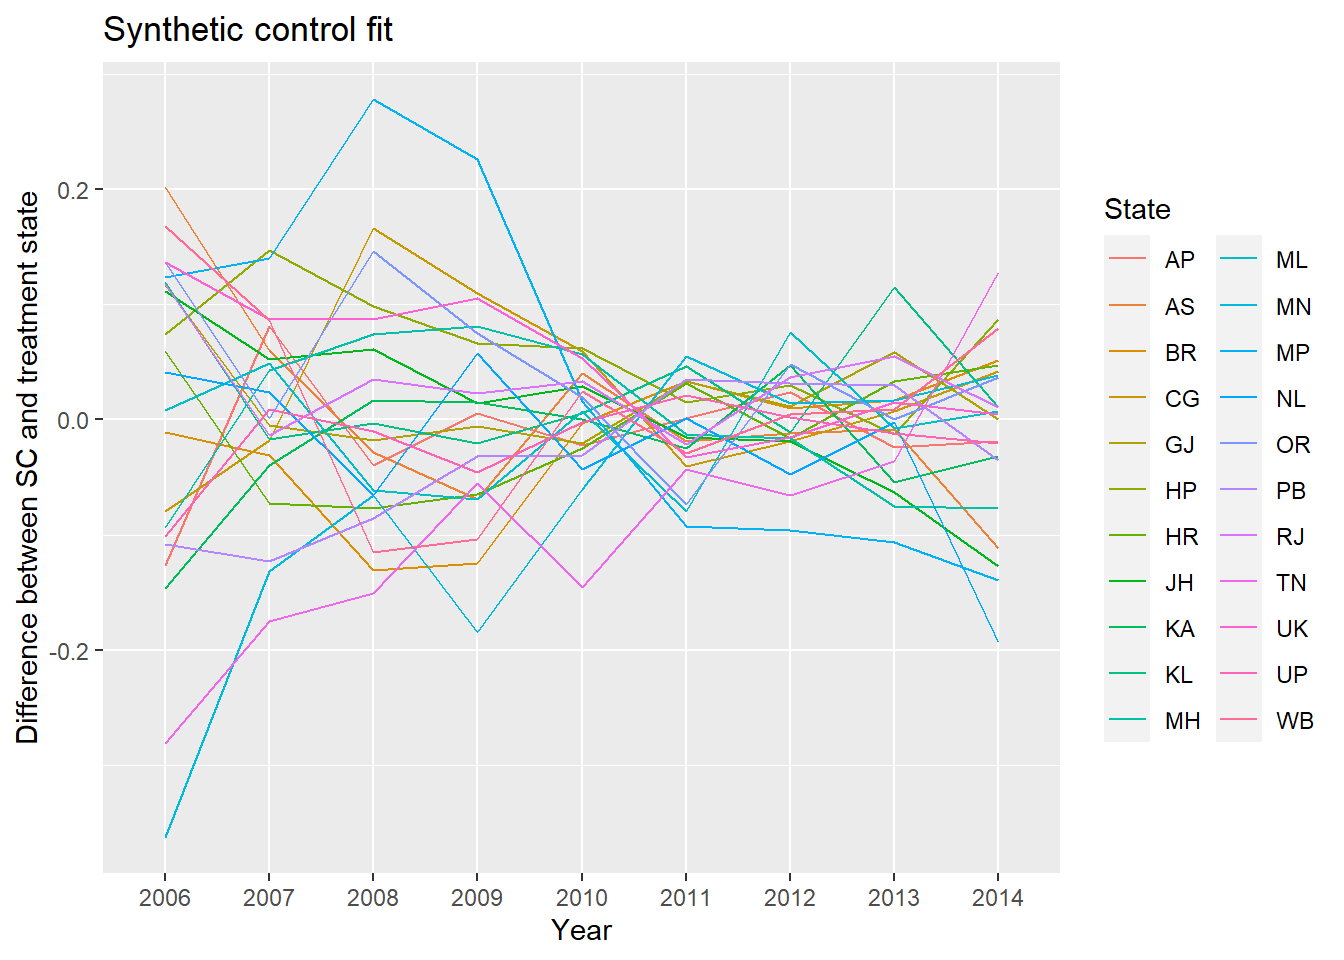
The figure above shows that the synthetic control created for Haryana grade 5 reading outcomes using the model specification provided in the code gave a poor fit for the data. The figure below shows that this model gives a poor fit for nearly all states. The figure shows the difference between the synthetic control and the “treatment” state for all states for which we have complete ASER data over this time period (i.e. I ran the model just like I did for Haryana for each other state and then calculated the difference between the state’s grade 5 reading levels and the grade 5 reading levels for the synthetic control). Ideally, the lines would all be near 0 for the entire period (unless they launched a major education reform).
These results are just for one outcome (grade 5 reading levels) and for one particular model specification but toying around with the model and outcome I couldn’t find any combination of model + outcome for which synthetic control seemed appropriate.
Postscript
In late 2017, Haryana launched “Saksham Ghoshna,” an equally ambitious follow-up project to QIP which also included regular student assessments as well as new dashboards and several other pedagogic interventions. Ironically, one of the officials involved claimed that the program was clearly successful because…learning outcomes had been going down prior to the project! In the officials words:
“If we look at NCERT’s various National Achievement Survey (NAS) and ASER reports, the surveys point out that the quality of school education in the state has been going down for years. Government school teachers in Haryana are well-qualified but somehow the link is missing. Classroom studies have not being meaningful. This was the initiation point.”